Document
Continuous-Microbial-Air-Monitoring-Application-Note-en-L-Sartorius
Contenu du document
Continuous Microbial Air Monitoring
in Clean Room Environments
Claudia Scherwing017%, Jasmin Bunke2??5
1. Product Development Lab Consumables Microbiology, Sartorius Stedim Biotech, Göttingen, Germany
2. Product Management Lab Essentials Microbiology, Sartorius Lab Instruments, Göttingen, Germany
* Correspondence
E-Mail: kai.nesemann@sartorius.com
Abstract
Environmental monitoring is an important part of quality assurance for the production environments of sterile pharma
ceutical products. Especially for aseptic filling lines where products are filled without a terminal sterilization step it is of utmost
importance for product safety and thus an essential part of the quality control strategy. Such ISO 5 graded manufacturing
environments are required to have < 1 colonyforming unit (?`#BCFU?pR?@ per m³ of air.
A typical method for monitoring contamination of air is to actively draw air and filter it through special gelatin filters.
According to Annex 1 to the EU GMP guide a minimum sample volume of 1 m³ of air should be taken per sample location.
Considering an 8 hours work shift 1 m?w? is a too low sample volume to reliably judge the air quality of the manufacturing environ
ment. One approach to improve product safety would be the implementation of a continuous air monitoring covering the
complete production process (at multiple sampling points).
Unlike agar plates, which would dry out during longterm sampling, the Gelatin membrane filters can be used for the whole
8 h period. Human intervention, such as change of agar plates, could then be avoided, thus lowering the risk of secondary
contaminations to nearly zero. February 2019
Keywords:
continuous air monitoring, clean room, gelatin filter,
MD8 Airscan
®, EU GMP Guideline Annex 1
Find out more: www.sartorius.com
Application Note
2
Introduction
The following study aimed to establish whether a continu
ous sampling (and multisampling point assay) provides
effective monitoring for the entire production process (?`#B8 h?pR?@
by determining whether trapped organisms can withstand
longterm drying stress with unaltered recovery.
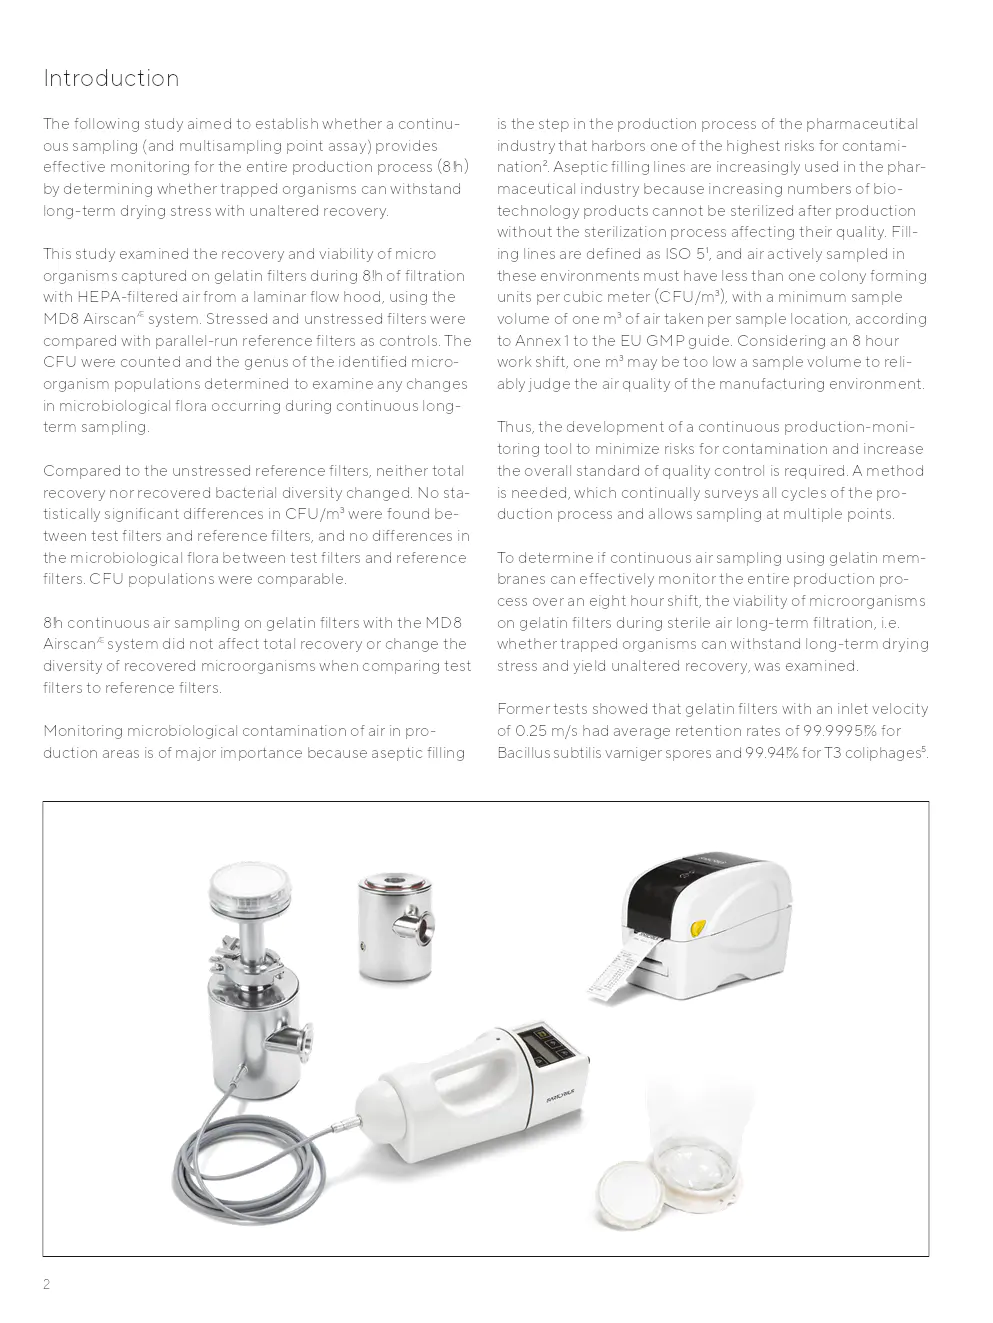
This study examined the recovery and viability of micro
organisms captured on gelatin filters during 8 h of filtration
with HEPAfiltered air from a laminar flow hood, using the
MD8 Airscan
® system. Stressed and unstressed filters were
compared with parallelrun reference filters as controls. The
CFU were counted and the genus of the identified micro
organism populations determined to examine any changes
in microbiological flora occurring during continuous long
term sampling.
Compared to the unstressed reference filters, neither total
recovery nor recovered bacterial diversity changed. No sta
tistically significant differences in CFU/m?w? were found be
tween test filters and reference filters, and no differences in
the microbiological flora between test filters and reference
filters. CFU populations were comparable.
8 h continuous air sampling on gelatin filters with the MD8
Airscan
® system did not affect total recovery or change the
diversity of recovered microorganisms when comparing test
filters to reference filters.
Monitoring microbiological contamination of air in pro
duction areas is of major importance because aseptic filling is the step in the production process of the pharmaceuti
cal
industry that harbors one of the highest risks for contami
nation2??5 . Aseptic filling lines are increasingly used in the phar
maceutical industry because increasing numbers of bio
technology products cannot be sterilized after production
without the sterilization process affecting their quality. Fill
ing lines are defined as ISO 5017%, and air actively sampled in
these environments must have less than one colony forming
units per cubic meter (?`#BCFU/m?w??pR?@, with a minimum sample
volume of one m?w? of air taken per sample location, according
to Annex 1 to the EU GMP guide. Considering an 8 hour
work shift, one m?w? may be too low a sample volume to reli
ably judge the air quality of the manufacturing environment.
Thus, the development of a continuous productionmoni
toring tool to minimize risks for contamination and increase
the overall standard of quality control is required. A method
is needed, which continually surveys all cycles of the pro
duction process and allows sampling at multiple points.
To determine if continuous air sampling using gelatin mem
branes can effectively monitor the entire production pro
cess over an eight hour shift, the viability of microorganisms
on gelatin filters during sterile air longterm filtration, i.e.
whether trapped organisms can withstand longterm drying
stress and yield unaltered recovery, was examined.
Former tests showed that gelatin filters with an inlet velocity
of 0.25 m/s had average retention rates of 99.9995 % for
Bacillus subtilis varniger spores and 99.94 % for T3 coliphages ` @?.
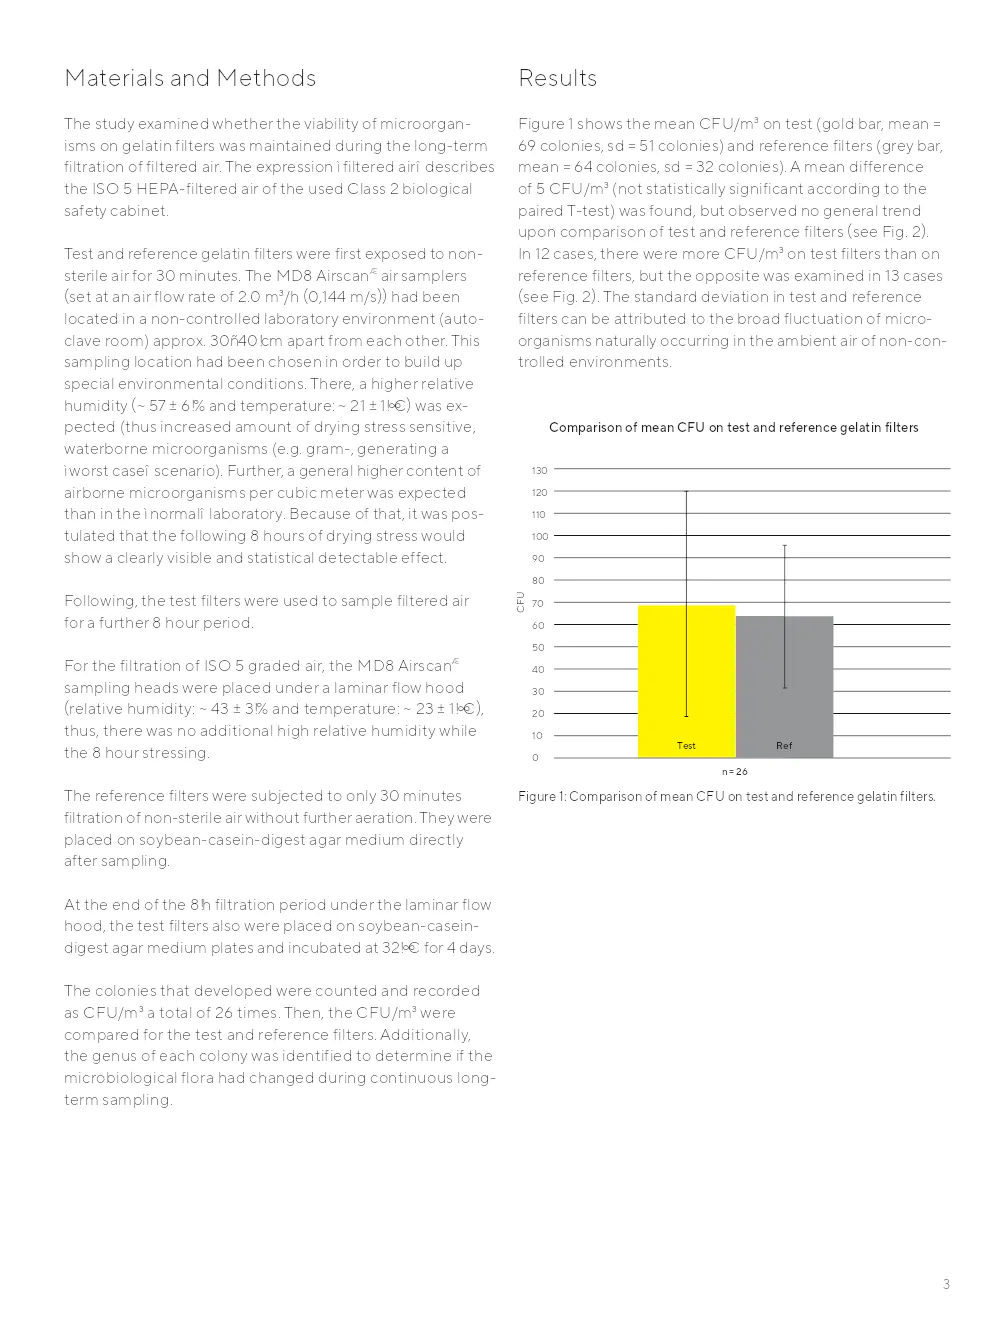
Figure 1: Comparison of mean CFU on test and reference gelatin filters.Comparison of mean CFU on test and reference gelatin filters
n = 26
0
130
120
110
100
90
80
70
60
50
40
30
20
10 Ref
Test
CFU
3
Materials and Methods
The study examined whether the viability of microorgan
isms on gelatin filters was maintained during the longterm
filtration of filtered air. The expression “filtered air” describes
the ISO 5 HEPAfiltered air of the used Class 2 biological
safety cabinet.
Test and reference gelatin filters were first exposed to non
sterile air for 30 minutes. The MD8 Airscan
® air samplers
(?`#Bset at an air flow rate of 2.0 m?w?/h (?`#B0,144 m/s?e$? had been
located in a noncontrolled laboratory environment (auto
clave room) approx. 30–40 cm apart from each other. This
sampling location had been chosen in order to build up
special environmental conditions. There, a higher relative
humidity (?`#B~ 57 ± 6 % and temperature: ~ 21 ± 1 °C?pR?@ was ex
pected (thus increased amount of drying stress sensitive,
waterborne microorganisms (e.g. gram, generating a
“worst case” scenario). Further, a general higher content of
airborne microorganisms per cubic meter was expected
than in the “normal” laboratory. Because of that, it was pos
tulated that the following 8 hours of drying stress would
show a clearly visible and statistical detectable effect.
Following, the test filters were used to sample filtered air
for a further 8 hour period.
For the filtration of ISO 5 graded air, the MD8 Airscan
®
sampling heads were placed under a laminar flow hood
(?`#B relative humidity: ~ 43 ± 3 % and temperature: ~ 23 ± 1 °C?pR?@,
thus, there was no additional high relative humidity while
the 8 hour stressing.
The reference filters were subjected to only 30 minutes
filtration of nonsterile air without further aeration. They were
placed on soybeancaseindigest agar medium directly
after sampling.
At the end of the 8 h filtration period under the laminar flow
hood, the test filters also were placed on soybeancasein
digest agar medium plates and incubated at 32 °C for 4 days.
The colonies that developed were counted and recorded
as CFU/m?w? a total of 26 times. Then, the CFU/m?w? were
compared for the test and reference filters. Additionally,
the genus of each colony was identified to determine if the
microbiological flora had changed during continuous long
term sampling.
Results
Figure 1 shows the mean CFU/m?w? on test (gold bar, mean =
69 colonies, sd = 51 colonies) and reference filters (grey bar,
mean = 64 colonies, sd = 32 colonies). A mean difference
of 5 CFU/m?w? (not statistically significant according to the
paired T test) was found, but observed no general trend
upon comparison of test and reference filters (?`#Bsee Fig. 2?pR?@.
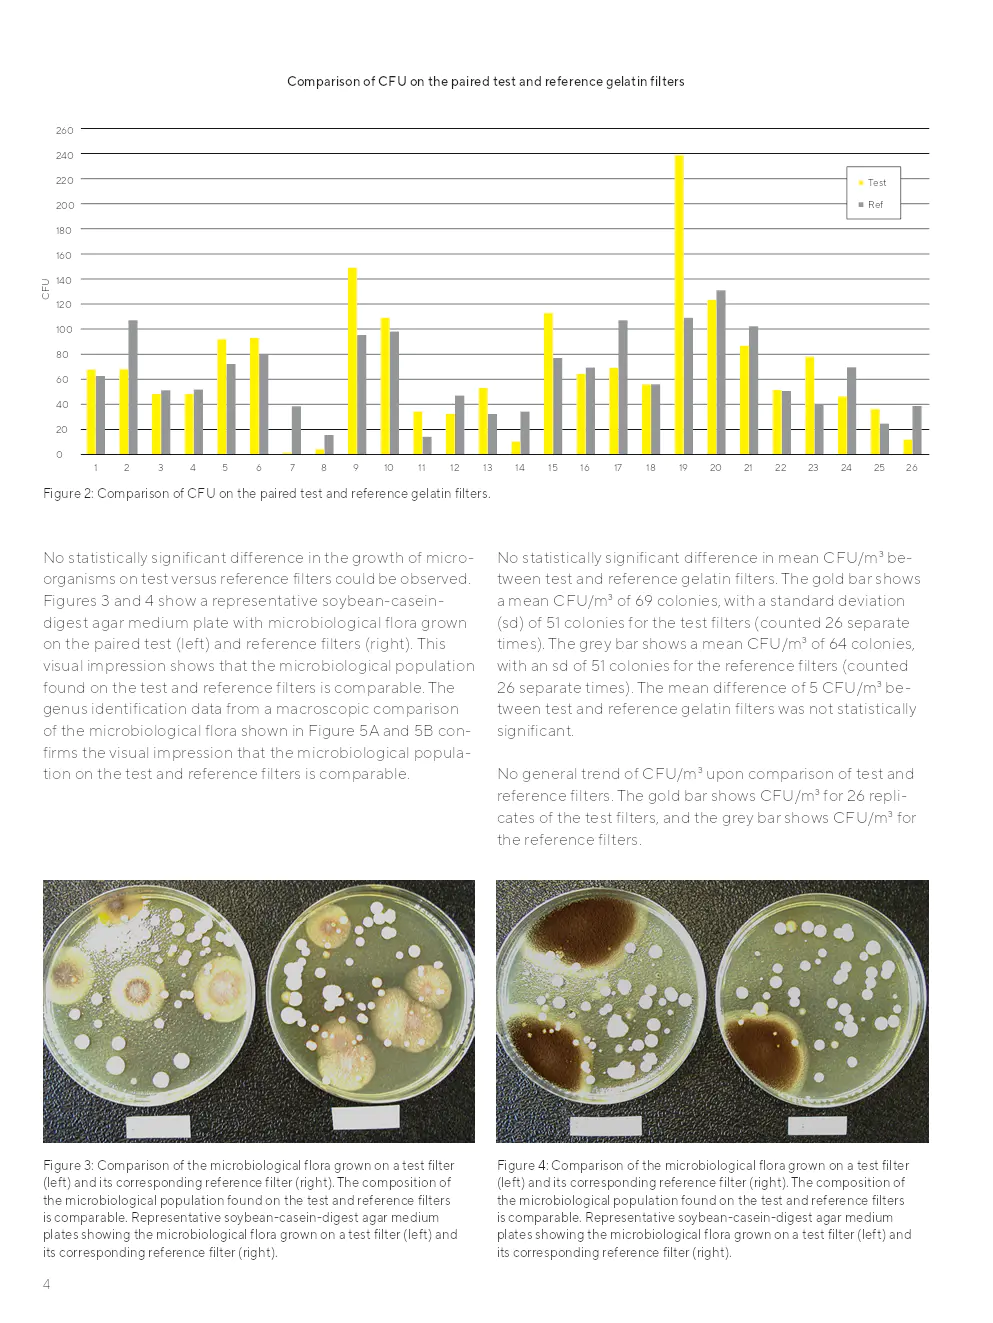
In 12 cases, there were more CFU/m?w? on test filters than on
reference filters, but the opposite was examined in 13 cases
(?`#Bsee Fig. 2?pR?@. The standard deviation in test and reference
filters can be attributed to the broad fluctuation of micro
organisms naturally occurring in the ambient air of noncon
trolled environments.
CFU
26
25
24
23
22
21
20
Figure 2: Comparison of CFU on the paired test and reference gelatin filters. Comparison of CFU on the paired test and reference gelatin filters
1
19
18
17
16
15
14
13
12
11
10
9
8
7
6
5
4
3
2
0
260
240
220
200
180
160
140
120
100
80
60
40
20
Test
Ref
4
No statistically significant difference in the growth of micro
organisms on test versus reference filters could be observed.
Figures 3 and 4 show a representative soybeancasein
digest agar medium plate with microbiological flora grown
on the paired test (left) and reference filters (right). This
visual impression shows that the microbiological population
found on the test and reference filters is comparable. The
genus identification data from a macroscopic comparison
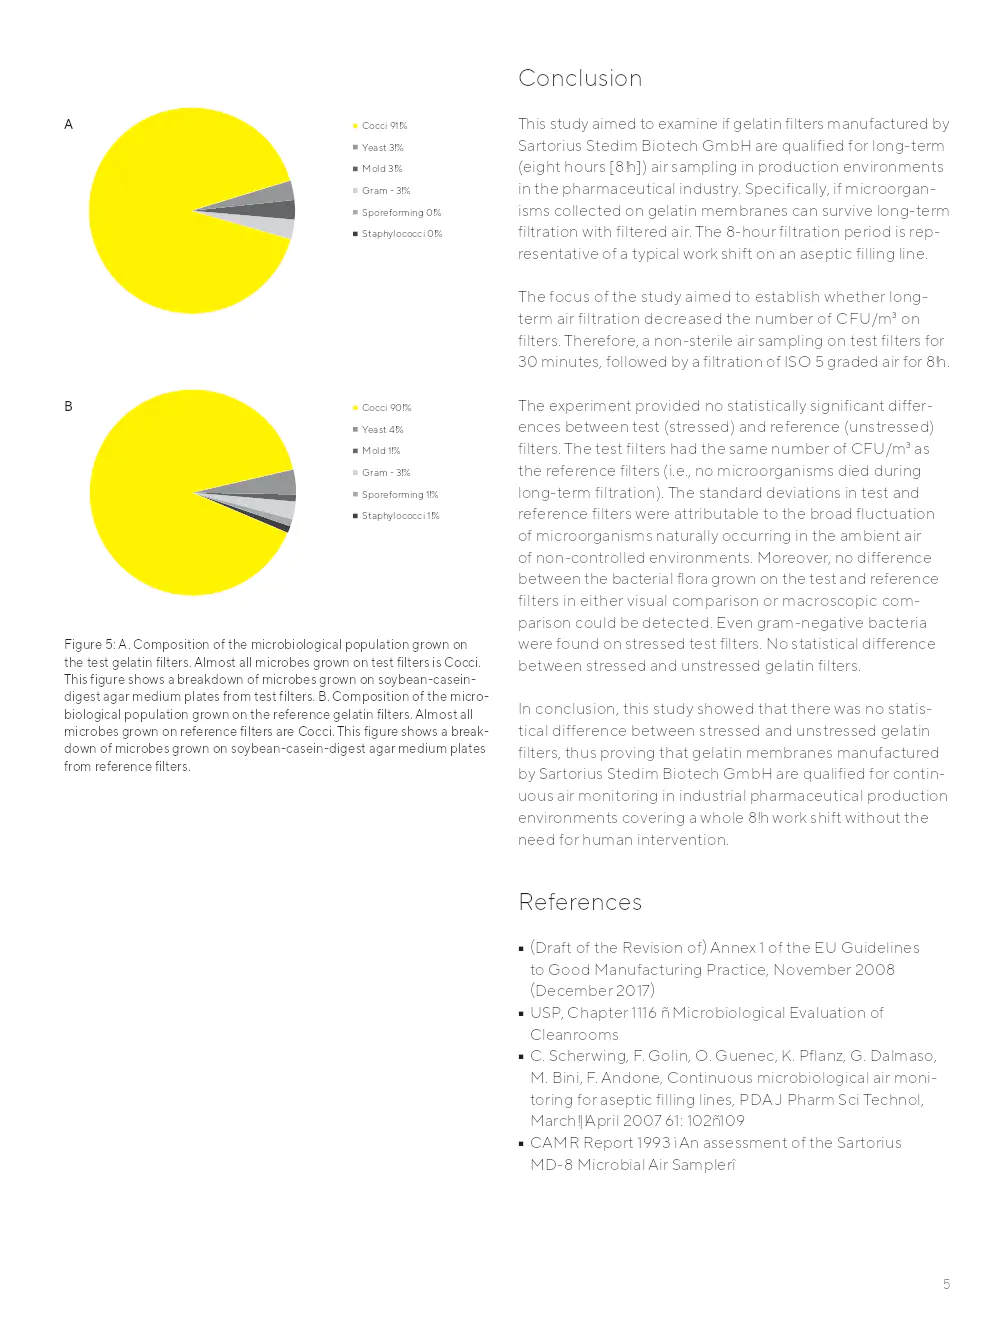
of the microbiological flora shown in Figure 5A and 5B con
firms the visual impression that the microbiological popula
tion on the test and reference filters is comparable. No statistically significant difference in mean CFU/m?w? be
tween test and reference gelatin filters. The gold bar shows
a mean CFU/m?w? of 69 colonies, with a standard deviation
(sd) of 51 colonies for the test filters (counted 26 separate
times). The grey bar shows a mean CFU/m?w? of 64 colonies,
with an sd of 51 colonies for the reference filters (counted
26 separate times). The mean difference of 5 CFU/m?w? be
tween test and reference gelatin filters was not statistically
significant.
No general trend of CFU/m?w? upon comparison of test and
reference filters. The gold bar shows CFU/m?w? for 26 repli
cates of the test filters, and the grey bar shows CFU/m?w? for
the reference filters.
Figure 3: Comparison of the microbiological flora grown on a test filter
(left) and its corresponding reference filter (right). The composition of
the microbiological population found on the test and reference filters
is comparable. Representative soybean-casein-digest agar medium
plates showing the microbiological flora grown on a test filter (left) and
its corresponding reference filter (right). Figure 4: Comparison of the microbiological flora grown on a test filter
(left) and its corresponding reference filter (right). The composition of
the microbiological population found on the test and reference filters
is comparable. Representative soybean-casein-digest agar medium
plates showing the microbiological flora grown on a test filter (left) and
its corresponding reference filter (right).
Cocci 91 %
Cocci 90 % Gram - 3
%
Gram - 3 %
Yeast 3 %
Yeast 4 %
Sporeforming 0 %
Sporeforming 1 %
Mold 3 %
Mold 1 %
Staphylococci 0 %
Staphylococci 1 % A
B
5
Conclusion
This study aimed to examine if gelatin filters manufactured by
Sartorius Stedim Biotech GmbH are qualified for longterm
(eight hours [8 h]) air sampling in production environments
in the pharmaceutical industry. Specifically, if microorgan
isms collected on gelatin membranes can survive longterm
filtration with filtered air. The 8hour filtration period is rep
resentative of a typical work shift on an aseptic filling line.
The focus of the study aimed to establish whether long
term air filtration decreased the number of CFU/m?w? on
filters. Therefore, a nonsterile air sampling on test filters for
30 minutes, followed by a filtration of ISO 5 graded air for 8 h.
The experiment provided no statistically significant differ
ences between test (stressed) and reference (unstressed)
filters. The test filters had the same number of CFU/m?w? as
the reference filters (i.e., no microorganisms died during
longterm filtration). The standard deviations in test and
reference filters were attributable to the broad fluctuation
of microorganisms naturally occurring in the ambient air
of noncontrolled environments. Moreover, no difference
between the bacterial flora grown on the test and reference
filters in either visual comparison or macroscopic com
parison could be detected. Even gramnegative bacteria
were found on stressed test filters. No statistical difference
between stressed and unstressed gelatin filters.
In conclusion, this study showed that there was no statis
tical difference between stressed and unstressed gelatin
filters, thus proving that gelatin membranes manufactured
by Sartorius Stedim Biotech GmbH are qualified for contin
uous air monitoring in industrial pharmaceutical production
environments covering a whole 8 h work shift without the
need for human intervention.
References
(?`#BDraft of the Revision of?pR?@ Annex 1 of the EU Guidelines
to Good Manufacturing Practice, November 2008
(?`#BDecember 2017?pR?@
USP, Chapter 1116 – Microbiological Evaluation of
Cleanrooms
C. Scherwing, F. Golin, O. Guenec, K. Pflanz, G. Dalmaso,
M. Bini, F. Andone, Continuous microbiological air moni
toring for aseptic filling lines, PDA J Pharm Sci Technol,
March | April 2007 61: 102–109
CAMR Report 1993 “An assessment of the Sartorius
MD8 Microbial Air Sampler”
Figure 5: A. Composition of the microbiological population grown on
the test gelatin filters. Almost all microbes grown on test filters is Cocci.
This figure shows a breakdown of microbes grown on soybean-casein-
digest agar medium plates from test filters. B. Composition of the micro-
biological population grown on the reference gelatin filters. Almost all
microbes grown on reference filters are Cocci. This figure shows a break-
down of microbes grown on soybean-casein-digest agar medium plates
from reference filters.
For further contacts, visit
www.sartorius.com
Specifications subject to change without notice.
Copyright Sartorius Lab Instruments GmbH & Co. KG.
Status: 10 | 2020
Germany
Sartorius Lab Instruments GmbH & Co. KG
Otto-Brenner-Strasse 20
37079 Goettingen
Phone +49 551 308 0 USA
Sartorius Corporation
565 Johnson Avenue
Bohemia, NY 11716
Phone +1 631 254 4249
Toll-free +1 800 635 2906
Entreprise(s) concernée(s) :
Date d'upload du document :
vendredi 17 février 2023
Document protégé
Document uniquement accessible aux visiteurs connectés
Pas encore de compte ?
Inscrivez-vous
Déjà un compte ? Cliquez ici pour vous connecter
Connectez-vous