application note sur le séquençage de l'ARNm pour l'analyse de l'expression génique différentielle
document sur le séquençage de l'ARNm pour l'analyse de l'expression génique


Contenu du document
microsynth® : the swiss dna company
application note · next generation sequencing
mRNA sequencing for differential gene expression analysis
Compare gene expression profiles obtained under different conditions and study genetic profiles from transcript to pathway level.
introduction
RNA sequencing, the analysis of gene expression profiles by next generation sequencing (NGS), has become a powerful tool to investigate the transcriptome of an organism. The comparison of two or more conditions (e.g. mutant vs. wild type) allows the identification of differentially expressed genes that are up- or downregulated under a specific condition. Typical applications include the comparison of gene expression profiles between normal and cancer tissue, cells in high and low nutrient environments, stressed and unstressed cells or cells from distinct developmental stages. Major prerequisites for any RNA sequencing study are the availability of an annotated reference genome or transcriptome and sufficient numbers of biological replicates.
microsynth’s competences and services
Differential gene expression analysis by RNA sequencing is one of Microsynth’s core competences. Based on years of experience, we provide a one-stop service from experimental design to bioinformatics analysis. You can either outsource the whole process or only single steps to us. To ensure high reliability and accuracy of our product, the whole RNA sequencing pipeline including the bioinformatics analysis was evaluated and validated based on RNA spike-ins designed by the External RNA Control Consortium (ERCC). For further information on our validation process and possibilities to validate your own study, please contact us.
experimental design
The gain and impact of a study highly depend on its experimental design. The use of controls as well as appropriate sampling and RNA isolation methods are only a few examples of points to consider. What is important for any RNA sequencing project is the number of biological replicates. To obtain statistically valid results for a differential gene expression analysis, we usually advise to include at least three biological replicates per condition. Make use of our experience – our NGS specialists are happy to assist you from the start.
RNA isolation
You can either perform the extraction yourself or outsource this critical step to us. Microsynth has extensive experience in RNA isolation from various demanding tissues and matrices.
library preparation and sequencing
Following a quality check of the RNA, we will either perform poly(A) enrichment or ribosomal RNA (rRNA) depletion, depending on the organism or the target RNA to be studied. This step is essential since total RNA includes a large fraction of rRNA and other non-mRNA species and sequencing should be restricted to mRNA to avoid losses in sequencing depth. A stranded Illumina cDNA library is created by reverse transcription including the ligation of sequencing adaptors with barcodes. Finally, the libraries are pooled and sequenced on the Illumina NextSeq platform with a typical single-end read length of 75 bp. The sequencing depth per sample highly depends on the studied organisms and the desired sensitivity. Benchmarks for complex eukaryotic genomes (e.g. human, rat, mouse) are 100-150 million reads for high sensitivity and 20-30 million reads for typical sensitivity. Prokaryotic genomes require approximately 5-fold fewer reads.
bioinformatics analysis
After quality control, the sequencing reads are mapped to the reference genome using the software Salmon or STAR, which both address the difficulty of mapping spliced reads. As input for statistical analysis, the reads that uniquely map to a gene are counted. The identification of differentially expressed genes is performed by specialized statistical software such as DESeq2. Read counts are normalized, and the variance based on the replicates per condition is calculated. Finally, statistical testing is applied to identify differentially expressed genes that are significantly up- or downregulated. For organisms with available pathway information, a complementary service is provided identifying significantly up- or downregulated pathways (Gene ontology and KEGG classification).
example results
The major outcomes of the differential gene expression analysis are the observed fold changes for each gene together with statistical measures and the normalized counts per sample. Statistics for all genes are additionally summarized in an interactive table together with boxplots visualizing the observed fold changes. The interactive table allows you to sort the data by any represented measure or to search for specific features of interest.
provided overview plots
For each comparison in the differential gene expression analysis, various graphs are provided for an easy and visual overview of the results. The graphs include MA plots visualizing the distribution of the differentially expressed genes, heatmaps for sample to sample distances, and the top up- and downregulated genes as well as principal component analysis plots.
pathway analysis results
The results for the complementary pathway analysis include graphical representations of the up- and downregulated pathways for both gene ontology and KEGG terms. The pathway analysis module is available for most common model organisms such as human, mouse, rat or E. coli. Information is provided for all genes involved in a pathway count and log fold change, allowing a more detailed analysis of the identified pathways.
related services
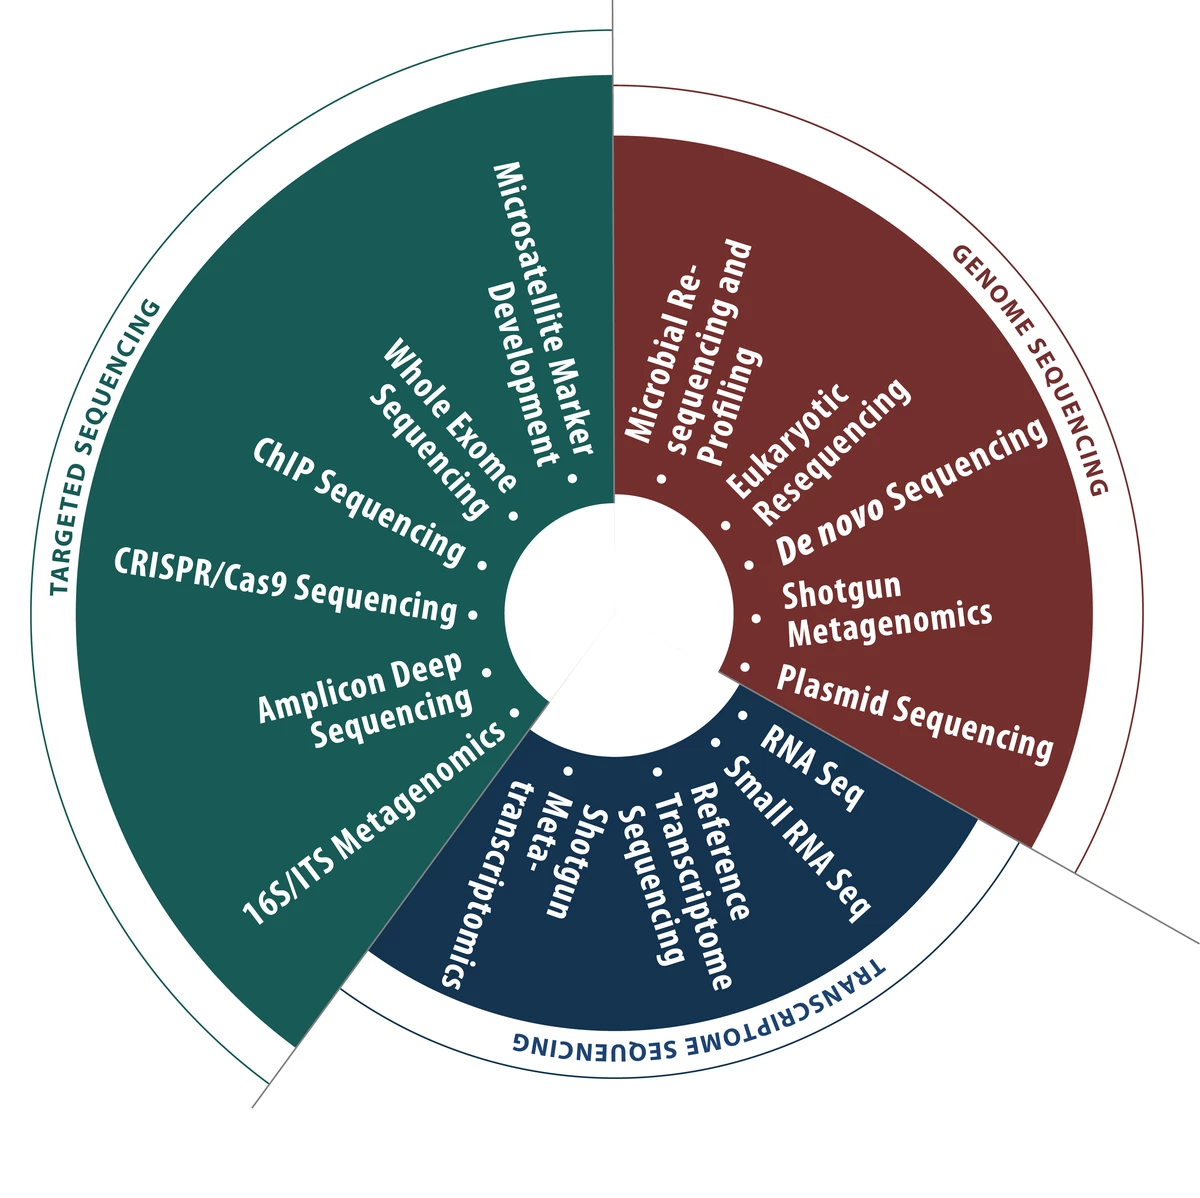
For the analysis of the small RNA fraction (e.g. microRNA) of an organism, please refer to our small RNA sequencing service. If you are interested in the transcriptional analysis of whole microbial communities, our shotgun metatranscriptomics service offers an attractive solution.
references
- Patro, R., Duggal, G., Love, M. I., Irizarry, R. A., & Kingsford, C. (2017). Salmon provides fast and bias-aware quantification of transcript expression. Nature Methods.
- Dobin et al. (2013) STAR: ultrafast universal RNA-seq aligner. Bioinformatics 29, 15–21. https://doi.org/10.1093/bioinformatics/bts635
- Love et al. (2014) Moderated estimation of fold change and dispersion for RNA-seq data with DESeq2. Genome Biol 15. https://doi.org/10.1186/s13059-014-0550-8
microsynth ag, switzerland
schützenstrasse 15 · p.o. box · ch?-?9436 balgach · phone +?41 71 722 83?33 · fax +?41 71 722 87?58 · info@microsynth.ch · www.microsynth.com